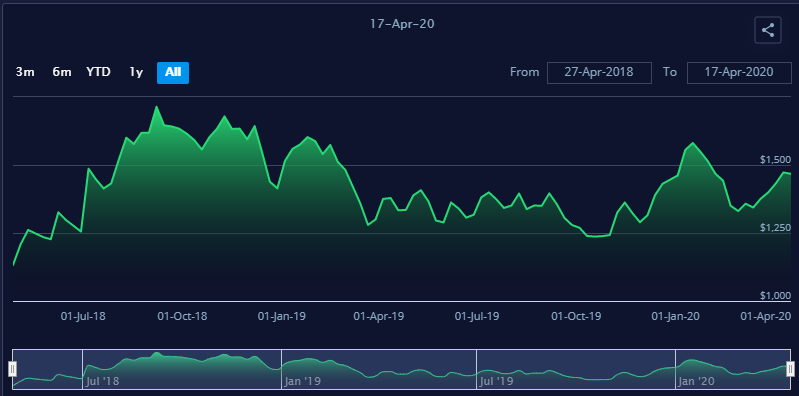
A shipper with a high volume of cargo to move by sea over time will negotiate a service contract with an ocean carrier, generally on an annual basis (the norm in the trans-Pacific market) or quarterly. Buying shipping services in bulk is designed to offer the shipper a lower per-slot cost through a volume discount.
Alternatively, a shipper can purchase freight on a spot basis. The spot price to move a container from Port A to B offers a real-time view of the current supply/demand balance in a particular trade lane. If the rate is falling, there’s too much capacity versus cargo volume, and vice versa.
Indices track the change in pricing along the main lanes for the cost to ship a 40-foot-equivalent-unit (FEU) container. A global container index is a weighted average of individual lane indices and offers a big-picture perspective on the worldwide supply/demand balance.
Looked at over a span of multiple years, global indices provide important insights on the ebb and flow of ocean container markets.
The challenge, of course, is to discern why an index is rising or falling. If it’s increasing, it could be because of rising cargo demand, whether due to economic strength in a particular import destination, some sort of geopolitical event, or some other reason. Or it could be because there’s not enough vessel supply. Which is it? If it’s both, how much of each?
One relatively clear example: The threat of tariffs by President Donald Trump convinced American importers to pull cargoes in ahead of time, which pushed up demand to the U.S. market during the second half of 2018, elevating trans-Pacific indices and thereby global indices.
In most cases, however, it’s not so simple. While the number of ships on a particular lane is known, carriers can “blank” (cancel) sailings to adjust capacity. Thus, if an index falls 10%, is that a true measure of falling demand, or was the demand decline 20%, with rates partially supported by blank sailings?
Container indices include the Shanghai Containerized Freight Index (SCFI), which was created by the Chinese government in 2005 and is operated by the Shanghai Shipping Exchange and published weekly; the Drewry Global Freight Rate Index (SONAR: WCI.GLOBCOMP), also published weekly; and (FBX). Freightos launched its weekly index in 2017, then teamed up with the Baltic Exchange in 2018 and subsequently launched the Freightos Baltic Daily Global Index (SONAR: FBXD.GLBL).

Source: Shanghai Shipping Exchange
The global index rate is calculated differently by different index providers. Drewry polls “a stable panel of buyers, around 30 freight forwarders and non-vessel-operating common carriers, who provide their buy rates and market data.”
The SCFI aggregates a mixture of spot rates for containers exported from Shanghai to 15 global reports, compiled by SCFI panelists as well as a number of carriers, forwarders and shippers.
Freightos’ global index is derived from a weighted average of 12 routes in various directions between Asia and the U.S., Asia and Europe, Europe and the U.S., and Asia and South America.

Source: FBX – Freightos Baltic Index
To get the route pricing, it takes anonymized, aggregated data from the carriers, forwarders and shippers that use its WebCargo by Freightos rate-management platform. According to Freightos, “The rates are not polled or tweaked in any way, shape or form.”
Source: FreightWaves


