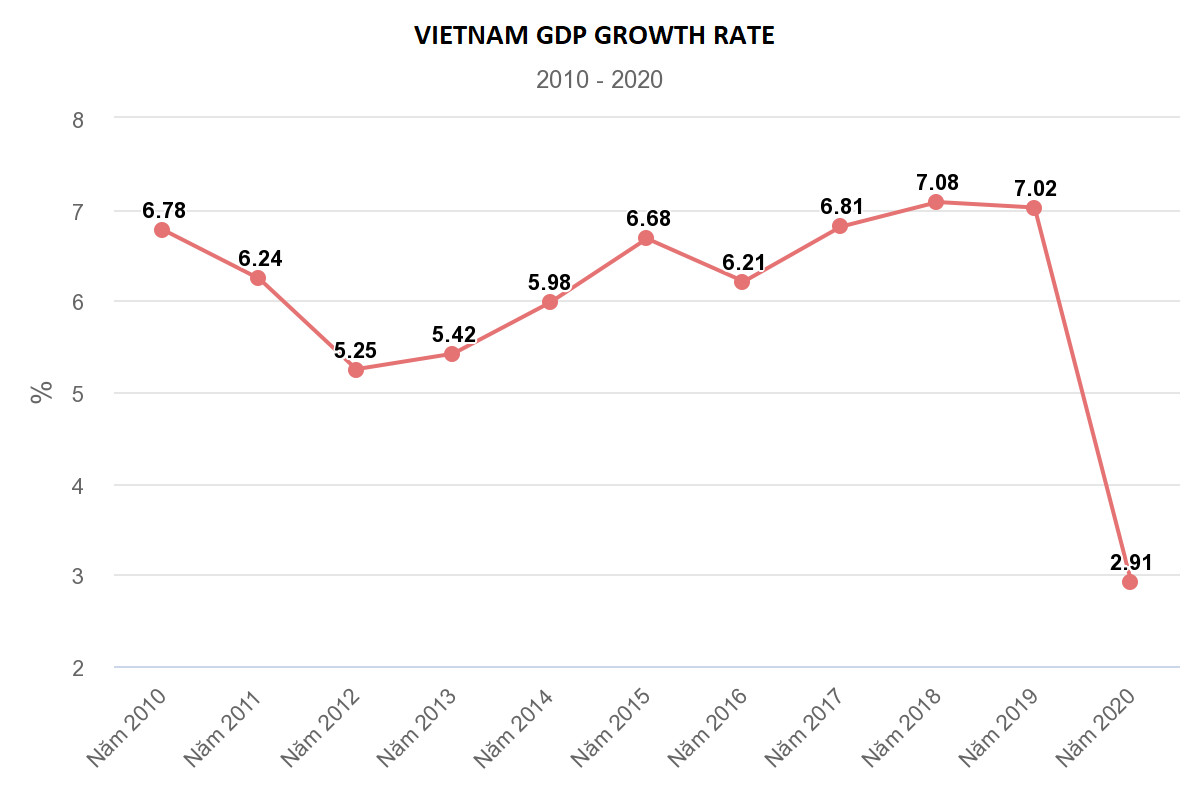
On Dec 27th, the General Statistics Office of Vietnam organized a press conference to publish the report on Vietnam economy for Q4 and the whole 2020.
In particular, the Q4 GDP has witnessed an expected growth rate of 4.48% compared with the same period last year, yet, this is the lowest growth recorded in a decade, from 2011 to 2020.
After the Covid-19 epidemic was basically controlled in Vietnam, our economy has gradually returned to a “new normal” condition. Besides, another highlight of this year is the official enforcement of the EU – Vietnam Free Trade Agreement (EVFTA) since Aug 1th, which has been a great catalyst behind the national economic development, especially in the Q4. Specifically, GDPs for the Agriculture, Forestry and Fishery; Industry and Construction; Services sectors have witnessed an increase of 4.69%, 5.60%, 4.29% respectively.
Other indicators for GDP in Q4 are as follow:
- Final consumption expenditure: up 1.48% year-on-year (YOY)
- Investment: up 5.29% YOY
- Export: up 15.25% YOY
- Import: up 14.83% YOY
- Export: up 15.25% YOY
- Import: up 14.83% YOY
Regarding 2020, this year’s GDP grows by 2.91% (Q1: up 3.68%; Q2: up 0.39%, Q3: up 2.69%, Q4: up 4.48%), which is the lowest growth rates in a decade. However, under the context of Covid-19 pandemic taking over 2020 with negative impacts on all socio-economic sectors, Vietnam has shown a great effort to overcome challenges with positive growth rate. This is desirable success when many other developed countries are struggling with GDP growth reaching its trough.

Among all industries, the Agriculture, Forestry and Fishery has grown by 2.68%, constituting 13.5% to the growth rate of Vietnam’s total added value. Meanwhile, the rates for Industry and Construction and Services sectors are 3.98% and 2.34% correspondingly.
The specific indicators for 2020 GDP of Vietnam are:
Final consumption expenditure: up 1.48% year-on-year (YOY)
- Final consumption expenditure: up 1.06% YOY
- Investment: up 4.12% YOY
- Export: up 4.97% YOY
- Import: up 3.33% YOY
Generally, the GDP structure for 2020, as reflected in the pie chart below, is slightly different from that for last year:

Translated by: Dandelion


